Downloadable Files
You can download CandleCharts AE for free at the end of this page.
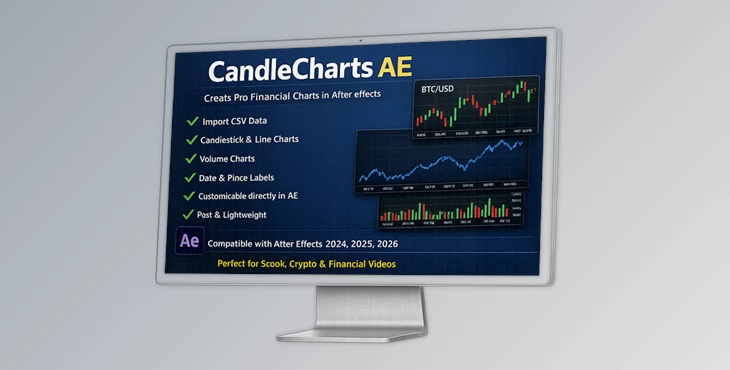
🚀 Introduction: Turn Data Into Stunning Visuals in Seconds
Imagine being able to create professional-quality financial charts without leaving After Effects — in just a few seconds! CandleCharts AE delivers this functionality to After Effects users.
Instead of spending hours creating your own financial charts, CandleCharts AE allows you to focus on your After Effects creative efforts — while the plugin takes care of the rest.
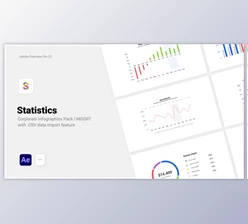
📊 What Is It & Why It Matters
At its core, CandleCharts AE is a tool that converts raw financial data (from a simple .csv file) into fully customizable charts directly inside After Effects.
💡 Why this is useful:
- You import your data once and instantly generate visuals.
- No need for complex expressions or external plugins.
- Everything stays lightweight and fast, improving render times.
🎯 Real-world use cases:
- Creating stock market animations for YouTube or social media
- Designing financial presentations for clients
- Building data-driven motion graphics for commercials
Because the charts are generated as editable layers, you can tweak every detail — which means better visuals, faster revisions, and more professional results.
🧩 Meet the Tool: A Smarter Way to Build Charts
CandleCharts AE is designed to make financial visualization effortless inside After Effects. It removes repetitive tasks and replaces them with a streamlined, one-click workflow.
✨ Features
Here's what makes it powerful:
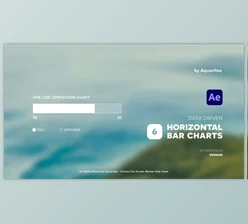
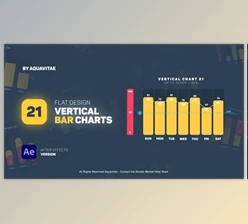
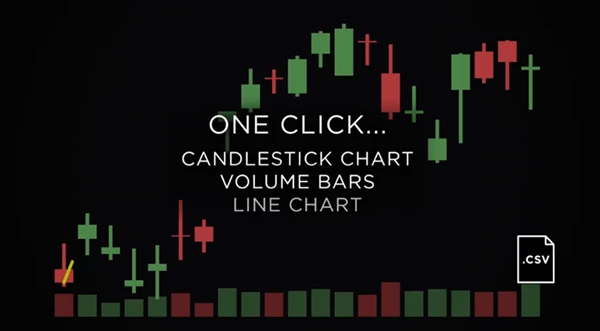
📈 Chart Types
- Filled candlestick charts
- Line charts (based on close data)
- Volume charts
🏷️ Smart Labeling
- Horizontal price labels
- Vertical date labels
🎨 Visual Customization
- Fully adjustable colors, fonts, and thickness
- Easy-to-use settings layers
- Built-in intro animations for every chart
⚙️Workflow Optimization
- Import .csv data and generate charts in one click.
- The smart layer system allows you to edit multiple chart elements quickly.
📐 Layout & Control
- Resize your charts by dragging the handles on the edges.
- Add decorative outlines or grids to your charts.
🎬 Real Impact in Projects
- CandleCharts AE allows a motion designer to convert stock market data into an animation in a few minutes.
- A content creator can design multiple charts with the same brand and colors.
- A design team can quickly generate different chart types for their projects.
🎯 Pro Tips & Techniques
- To get the most out of CandleCharts AE, try these techniques:
- Use the settings layers to define your design elements at the start.
- Use the tagging system to select and edit chart components quickly.
- Use the built-in animation to liven up your charts.
- Keep your .csv file neat and clean.
- Resize your charts using the handles on the edges.
🔥 Final Thoughts
CandleCharts AE is a powerful tool that allows designers to create beautiful, professional financial charts within After Effects. With this tool, you’ll save time and create stunning visuals for your projects. For anyone interested in improving their motion graphic design workflows, this tool is definitely worth trying out.

Files Password : gfxplugin.com OR 123456