Downloadable Files
You can download DataInk for InDesign for free from the bottom of this page.
Turn Your Data into Editable InDesign Charts
DataInk is a chart creation plugin for Adobe InDesign that turns your data into editable charts directly inside your document. It supports 13 chart types and works with InDesign tables, spreadsheets, CSV files, and even data extracted from PDFs using optional AI tools.
Unlike charts imported as images, DataInk creates real InDesign shapes and text. You can change their colors, edit labels, adjust styles, and update the numbers without rebuilding the chart.
Build Editable Charts Directly in InDesign
DataInk creates charts using native InDesign objects rather than external images or linked graphics. Every bar, line, label, and legend remains editable inside your document.
You can select individual elements, change their appearance, adjust text spacing, or apply your existing document styles. Because the charts use native paths and text, they also remain sharp when printed.
Another important feature is the ability to update existing charts. When your data changes, select the chart and click Update to refresh it.
This is particularly helpful for reports and publications where numbers may change several times before the final document is ready.
13 Chart Types for Different Data
DataInk includes 13 chart types that you can create from the same panel.
The available chart types are:
Column and Bar: Display values using vertical or horizontal bars.
Stacked and 100% Stacked: Show how different values contribute to a total.
Line: Display changes and trends across data points.
Area: Present data with filled areas beneath the lines.
Combo: Combine chart styles and use a second axis.
Pie: Show different parts of a whole.
Doughnut and Half Doughnut: Present proportions in circular layouts.
Radial Bar: Display values using circular bars.
Treemap: Organize values into differently sized rectangular areas.
Radar: Compare several values across multiple axes.
You can switch between chart types with one click while keeping your existing data. This gives you the flexibility to choose a different visual presentation without entering the figures again.
Import Data from Tables and Spreadsheets
DataInk supports several ways to bring numbers into your charts. You can use data already available in InDesign or import information from other sources.
| Data source | How it works |
|---|---|
| InDesign tables | Create charts directly from existing tables |
| Excel and Numbers | Use spreadsheet data |
| Google Sheets | Bring spreadsheet information into DataInk |
| CSV and TSV | Import structured data files |
| Manual entry | Type values into the built-in spreadsheet-style editor |
| PDF or screenshot | Extract table data using optional AI |
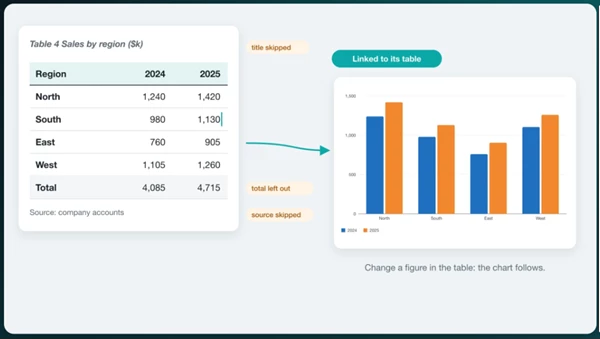
One useful feature is its connection to InDesign tables. You can click inside a table and turn its values into a chart. When the table data changes, the connected chart can be updated to reflect the new figures.
The built-in data editor also provides a place to enter and modify numbers without leaving the plugin.
Match Charts to Your Document Styles
DataInk uses your existing InDesign swatches and paragraph styles to keep charts consistent with the rest of your publication.
You can select a swatch group and apply its colors to your chart. The plugin supports CMYK colors, spot colors, and different tints of a single brand color.
Text elements such as titles, labels, and values can use your paragraph styles.
This is useful when creating a report with many charts that need to follow the same visual design. You can also save chart presets and share them with other team members.
Optional AI Tools for Working with Data
DataInk includes optional AI features for extracting information and making changes using natural language.
Extract Tables from PDFs and Screenshots
You can select a PDF document or screenshot and tell DataInk which table you want to use.
The AI reads the figures and prepares them for chart creation. If it is uncertain about particular cells, those cells are highlighted so you can check the values before inserting the chart into your layout.
This feature is designed for situations where the data is available in a report but not in an editable spreadsheet.
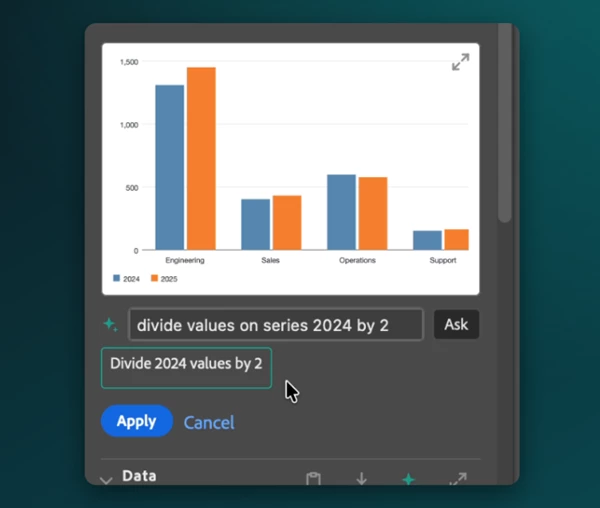
Change Charts Using Simple Instructions
DataInk also lets you describe changes in everyday language.
For example, you can ask it to:
Divide the values for 2024 by two.
Sort the data in descending order.
Move the chart legend to the right.
The plugin shows the proposed changes before you apply them.
It can also suggest chart headlines based on your numbers and generate alt text for accessible PDF documents.
Choose Your AI Provider
DataInk supports OpenAI, Claude, Gemini, and local models such as Ollama.
You can connect your preferred provider using your own API key or use a local model for documents that need to remain on your computer.
When using an external provider, data is sent directly from InDesign to that provider. With a local model, the processing can remain on your machine.
AI is optional. The standard chart creation, editing, and styling features work without it.
Where DataInk Works Best
DataInk is designed for InDesign documents that contain charts, statistics, and frequently updated figures.
It can be used for:
Annual and sustainability reports: Present financial, environmental, and performance data.
Investor and sales presentations: Display business figures using consistent chart styles.
Magazines and newsletters: Add editable data visualizations to editorial layouts.
Data journalism: Turn research figures into charts for publication.
Research and public-sector documents: Present statistical information in structured reports.
Because the charts remain native InDesign objects, colleagues can open, print, and export documents containing DataInk charts without having the plugin installed.

Files Password : gfxplugin.com OR 123456