Downloadable Files
You can download the Render Profiler for free from the bottom of this page.
🔹 Introduction – Why Your Renders Feel Slow
If you’ve ever stared at a Blender render wondering, “Why is this taking forever?”, you’re not alone. Performance issues in 3D scenes can be frustrating, especially when everything looks fine on the surface. That’s exactly where Render Profiler comes in. It gives you a clear, real-time breakdown of what’s actually happening behind the scenes—turning guesswork into precise insight. Instead of guessing what’s wrong, you see it.
🔹 What Is Render Profiler and Why It Matters
Render Profiler is a Blender add-on designed to analyze both viewport and render performance in a simple, visual way. It generates a live HTML report that updates automatically while you work.
Why is this useful?
- Instead of wondering “what’s slow?”, you get exact timing data.
- Instead of guessing memory usage, you see which assets are heavy.
- Instead of assuming mesh complexity, you compare real stats.
Real-world examples:
- A scene renders slowly → You discover one modifier taking most of the time.
- GPU memory is full → You identify oversized textures instantly.
- Scene feels heavy → You find a mesh with millions of unnecessary polygons.
These insights directly improve your workflow by helping you optimize smarter, not harder.
🔹 Meet the Tool – Render Profiler
Render Profiler is a professional yet easy-to-use tool that opens a live report in your browser and keeps it synced with Blender. You can access it via:
- Topbar → Window → Render Profiler Report
- Or press F4 → Render Profiler Report
🔹 Features
📊 Live Performance Report
- Automatically updates in your browser
- Works in both viewport and render modes
- No need to manually refresh
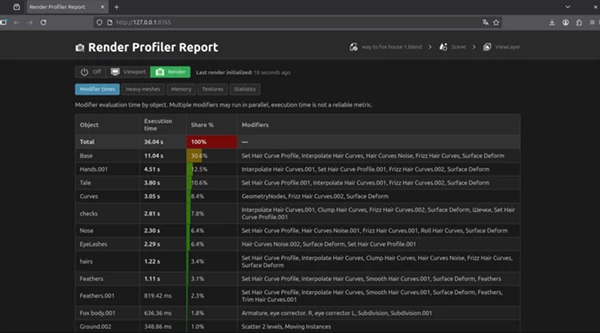
⚙️ Modifier Timing Analysis
- Shows execution time per modifier
- Helps identify performance bottlenecks
- Sorted by total impact
🧩 Heavy Mesh Detection
- Displays vertices, edges, faces, triangles
- Highlights dense objects instantly
- Shows instance counts
💾 Memory Breakdown
- Estimates the memory usage of meshes, textures, and curves
- Helps optimize GPU usage
- Unified and sortable data
🖼️ Texture Insights
- Lists textures used in the scene
- Shows size, resolution, and usage
- Identifies memory-heavy images
📈 Statistics Overview
- Total geometry counts.
- Object and instance numbers.
- Texture memory totals.
- Debug stats for deeper analysis.
🔄 Mode Switching
- Viewport Mode → Real-time updates while working
- Render Mode → Data collected during rendering (F12).
- Off Mode → Stops profiling to save performance.
🔹 Pro Tips for Better Results
- Use Render Mode when optimizing the project
- Turn profiling off when not needed
- Focus on modifier timings first
- Check texture sizes
- Compare viewport mesh stats to render mesh stats
Tip: Always focus on the most heavily weighted elements in your project first to gain the biggest performance gains right away.

🔹Final Thoughts – Smarter Rendering Starts Here
The Render Profiler gives you a better understanding of rendering in Blender. You can finally prepare your project for a client or improve your production in as little as a few minutes. Try the Render Profiler for Blender—the next time you render your project, you’ll never look at it the same way again.

Files Password : gfxplugin.com OR 123456